Projects & Portfolio
Explore my research and technical projects showcasing innovations in machine learning, causal inference, and computer vision. Click on any project to expand and view details.
Research Projects
Solution-Set Transformer: Graph Transformer for fMRI Classification
▼A two-level deep learning architecture for classifying healthy controls vs. schizophrenia patients directly from fMRI functional connectivity graphs — and critically, from the multi-graph equivalence class that RASL-based causal discovery produces for each subject.
Architecture:
- Graph encoder: BrainNetTransformer-style Graph Transformer encodes each candidate causal graph into a fixed-size embedding.
- Set Transformer: Permutation-invariant aggregator over the variable-size set of candidate graphs per subject — a capability uniquely enabled by RASL's multi-solution output.
- Diagnostic head: Binary classifier trained end-to-end, learning biomarkers that emerge only from the full equivalence class.
This is the first architecture to treat the causal equivalence class itself as a first-class input, rather than collapsing it to a single representative graph.
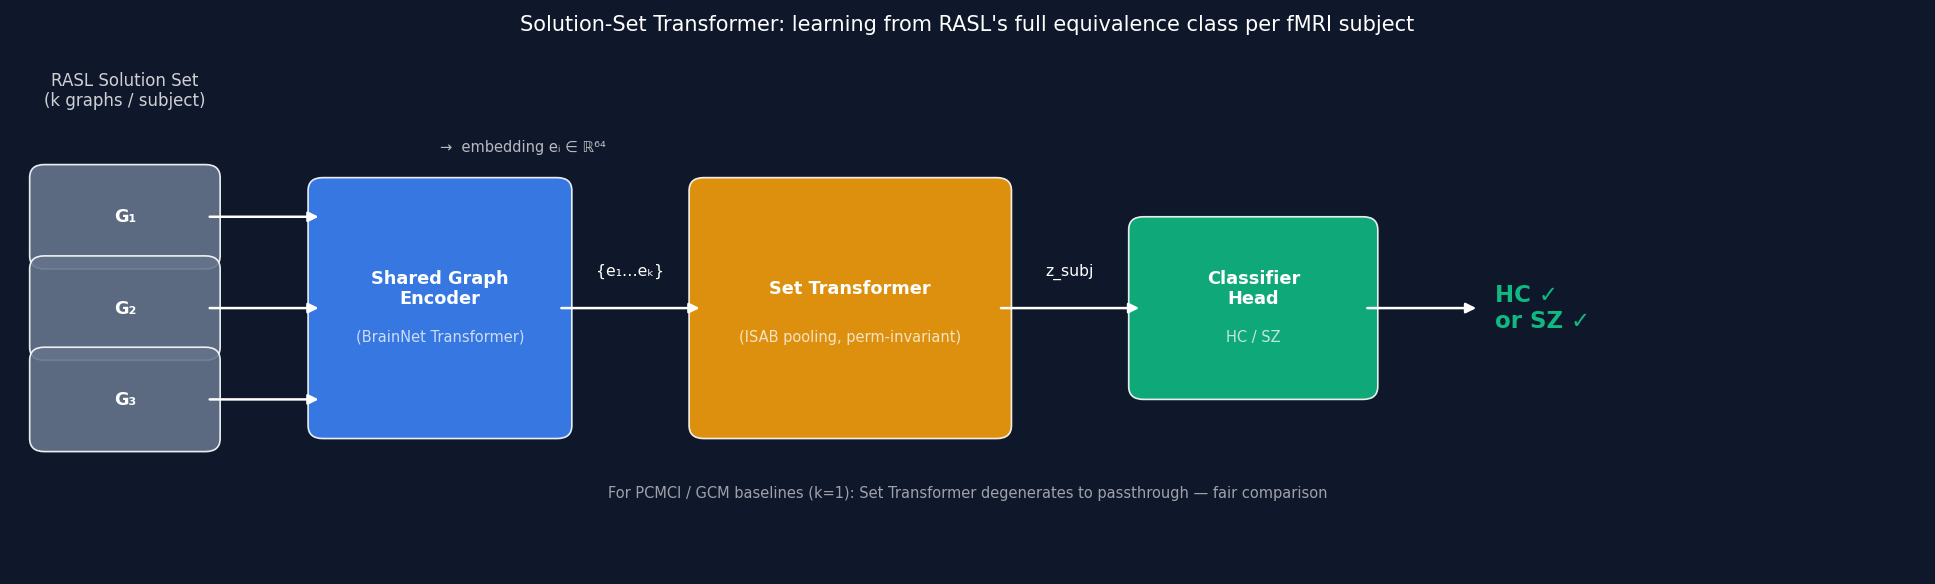
Two-level architecture: Graph Transformer encoder + Set Transformer aggregator over RASL solution sets.
GRACE-C: Generalized Rate Agnostic Causal Estimation via Constraints
▼This project tackles a critical and notoriously difficult problem in time-series analysis: learning true causal structures when data is measured much slower than the true underlying process (i.e., "undersampling"). This mismatch is common in fields like neuroscience—where fMRI scans are far slower than neural activity—and leads to standard causal learning methods producing misleading results.
The core innovation of this work is a new algorithm, sRASL (Solver-based Rate-Agnostic Structure Learning), which finds the true, fast-timescale causal graph without knowing the undersampling rate. This was achieved by skillfully reformulating the (NP-complete) search problem into a highly efficient constraint satisfaction problem. This approach demonstrates a strong command of Answer Set Programming (ASP), a sophisticated declarative logic framework used to solve complex combinatorial problems.
The project's mathematical rigor is showcased in two key areas:
- Novel Constraints: The algorithm's speed does not come from a simple translation to ASP. It integrates novel theoretical insights, introducing new constraints based on the graph-theoretic properties of Strongly Connected Components (SCCs). This innovation prunes the search space exponentially, enabling massive performance gains.
- Formal Guarantees: The method was formally proven to be correct and complete by showing it is a "direct encoding" of the undersampling problem, guaranteeing it finds the entire set of valid solutions.
Finally, the algorithm includes a robust optimization mode that handles real-world statistical noise, allowing it to find the 'closest' valid causal graph even when the input data is imperfect.
The results were a breakthrough in scalability, demonstrating:
- Speed: A speed-up of over three orders of magnitude (e.g., reducing a benchmark from ~1000 minutes to 6 seconds).
- Scale: The ability to analyze graphs with over 100 nodes, a massive leap from the previous 6-node limit.
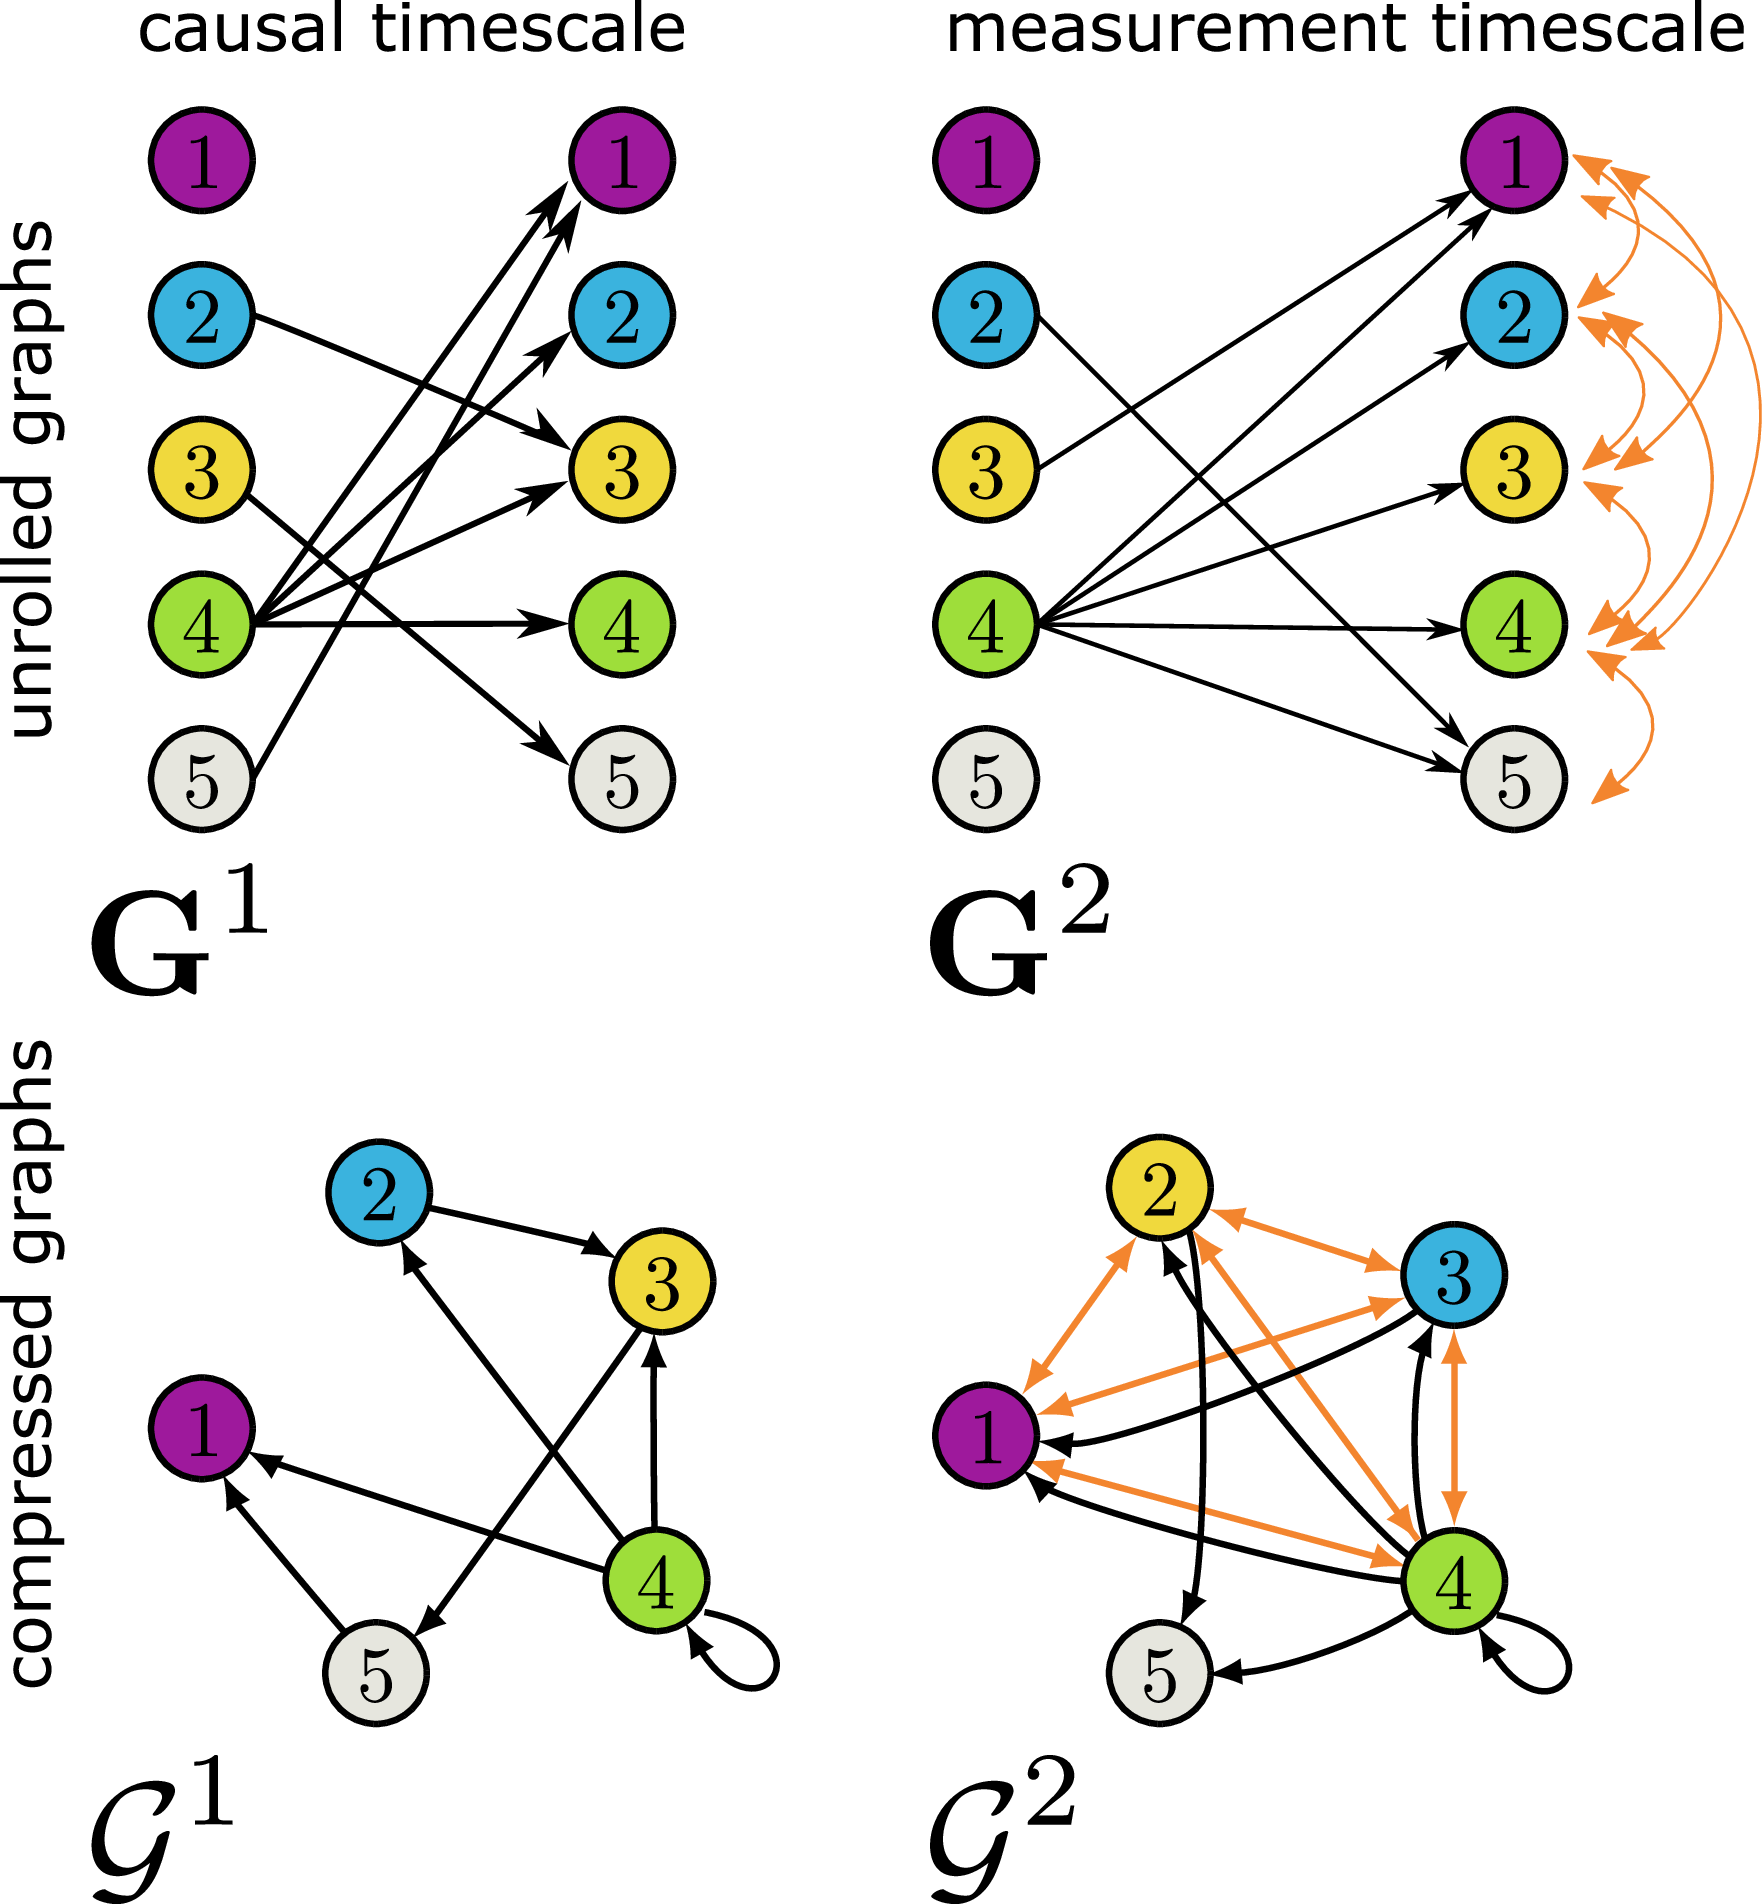
Visualizing how undersampling affects the causal graph.
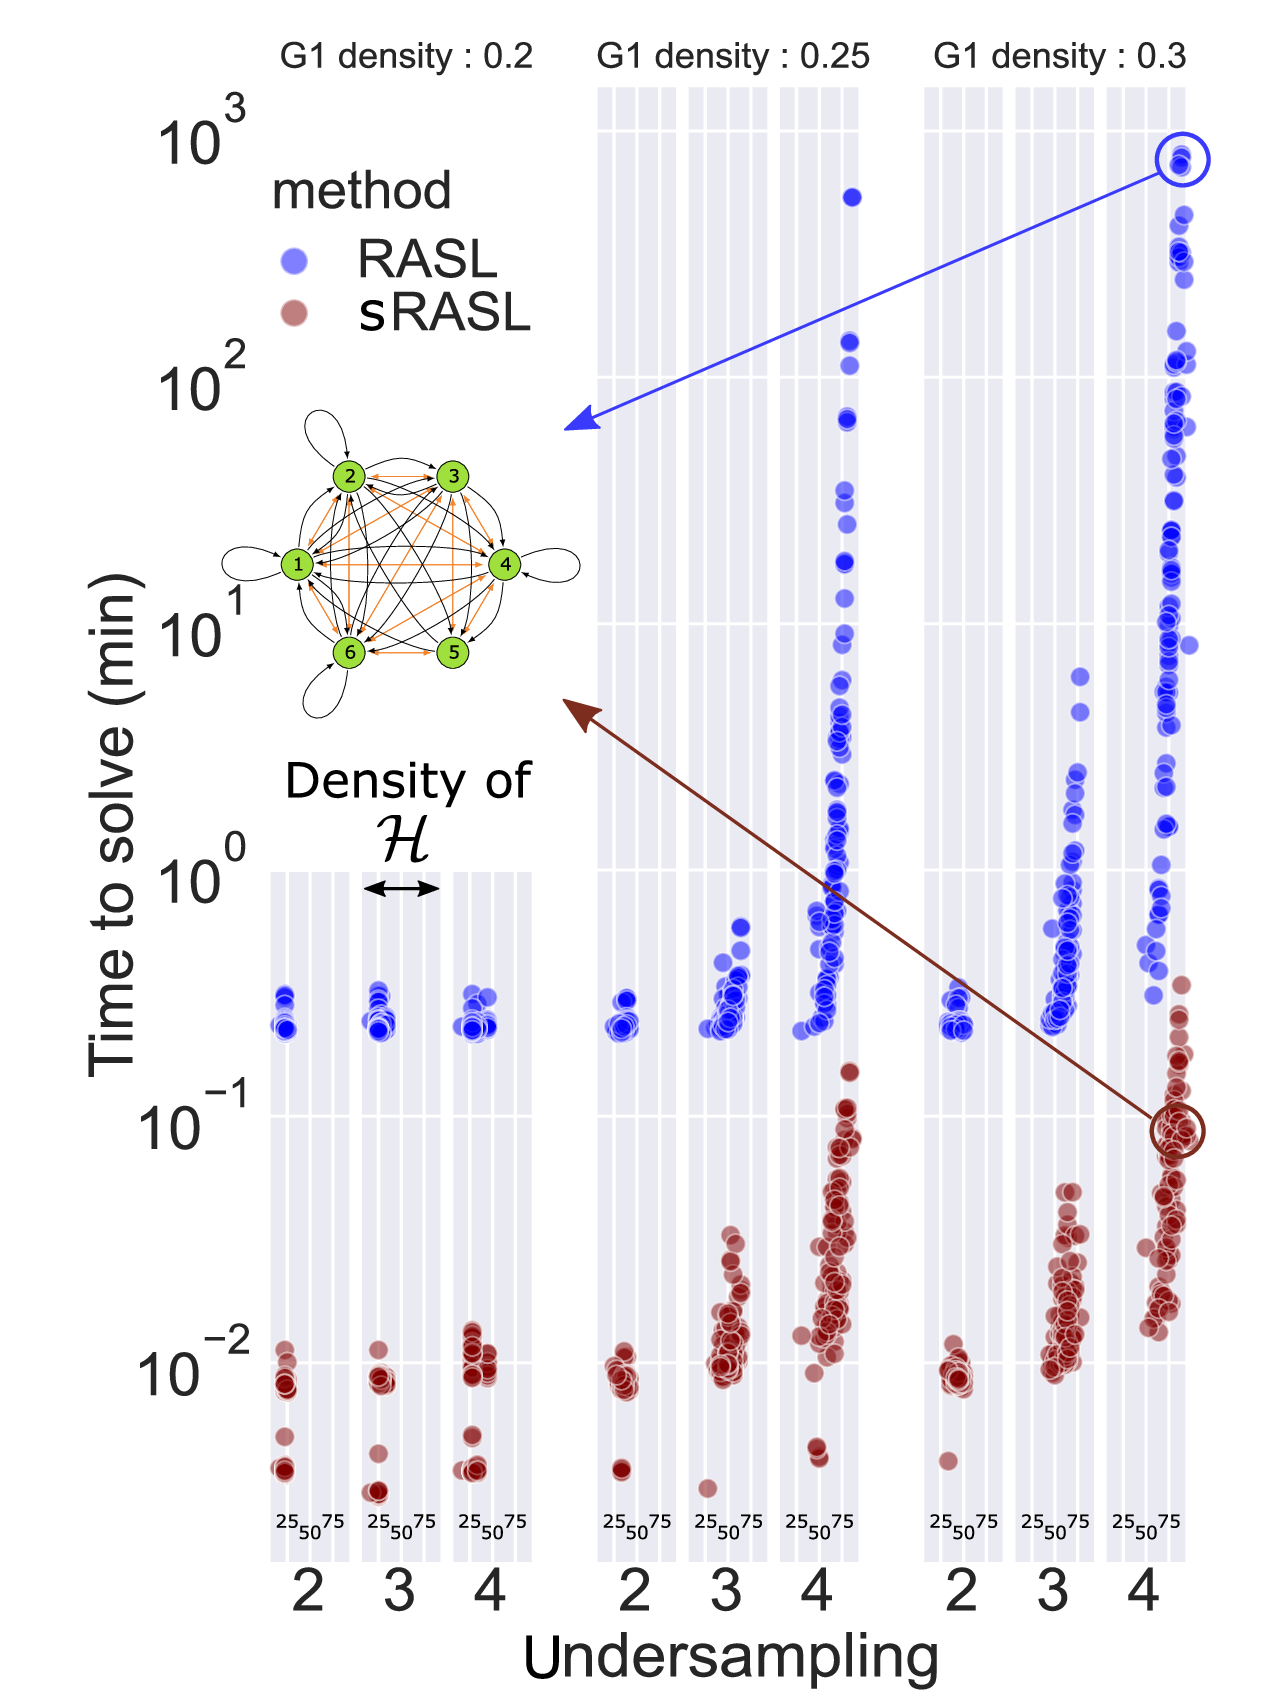
Performance comparison showing GRACE-C's dramatic speed improvements.
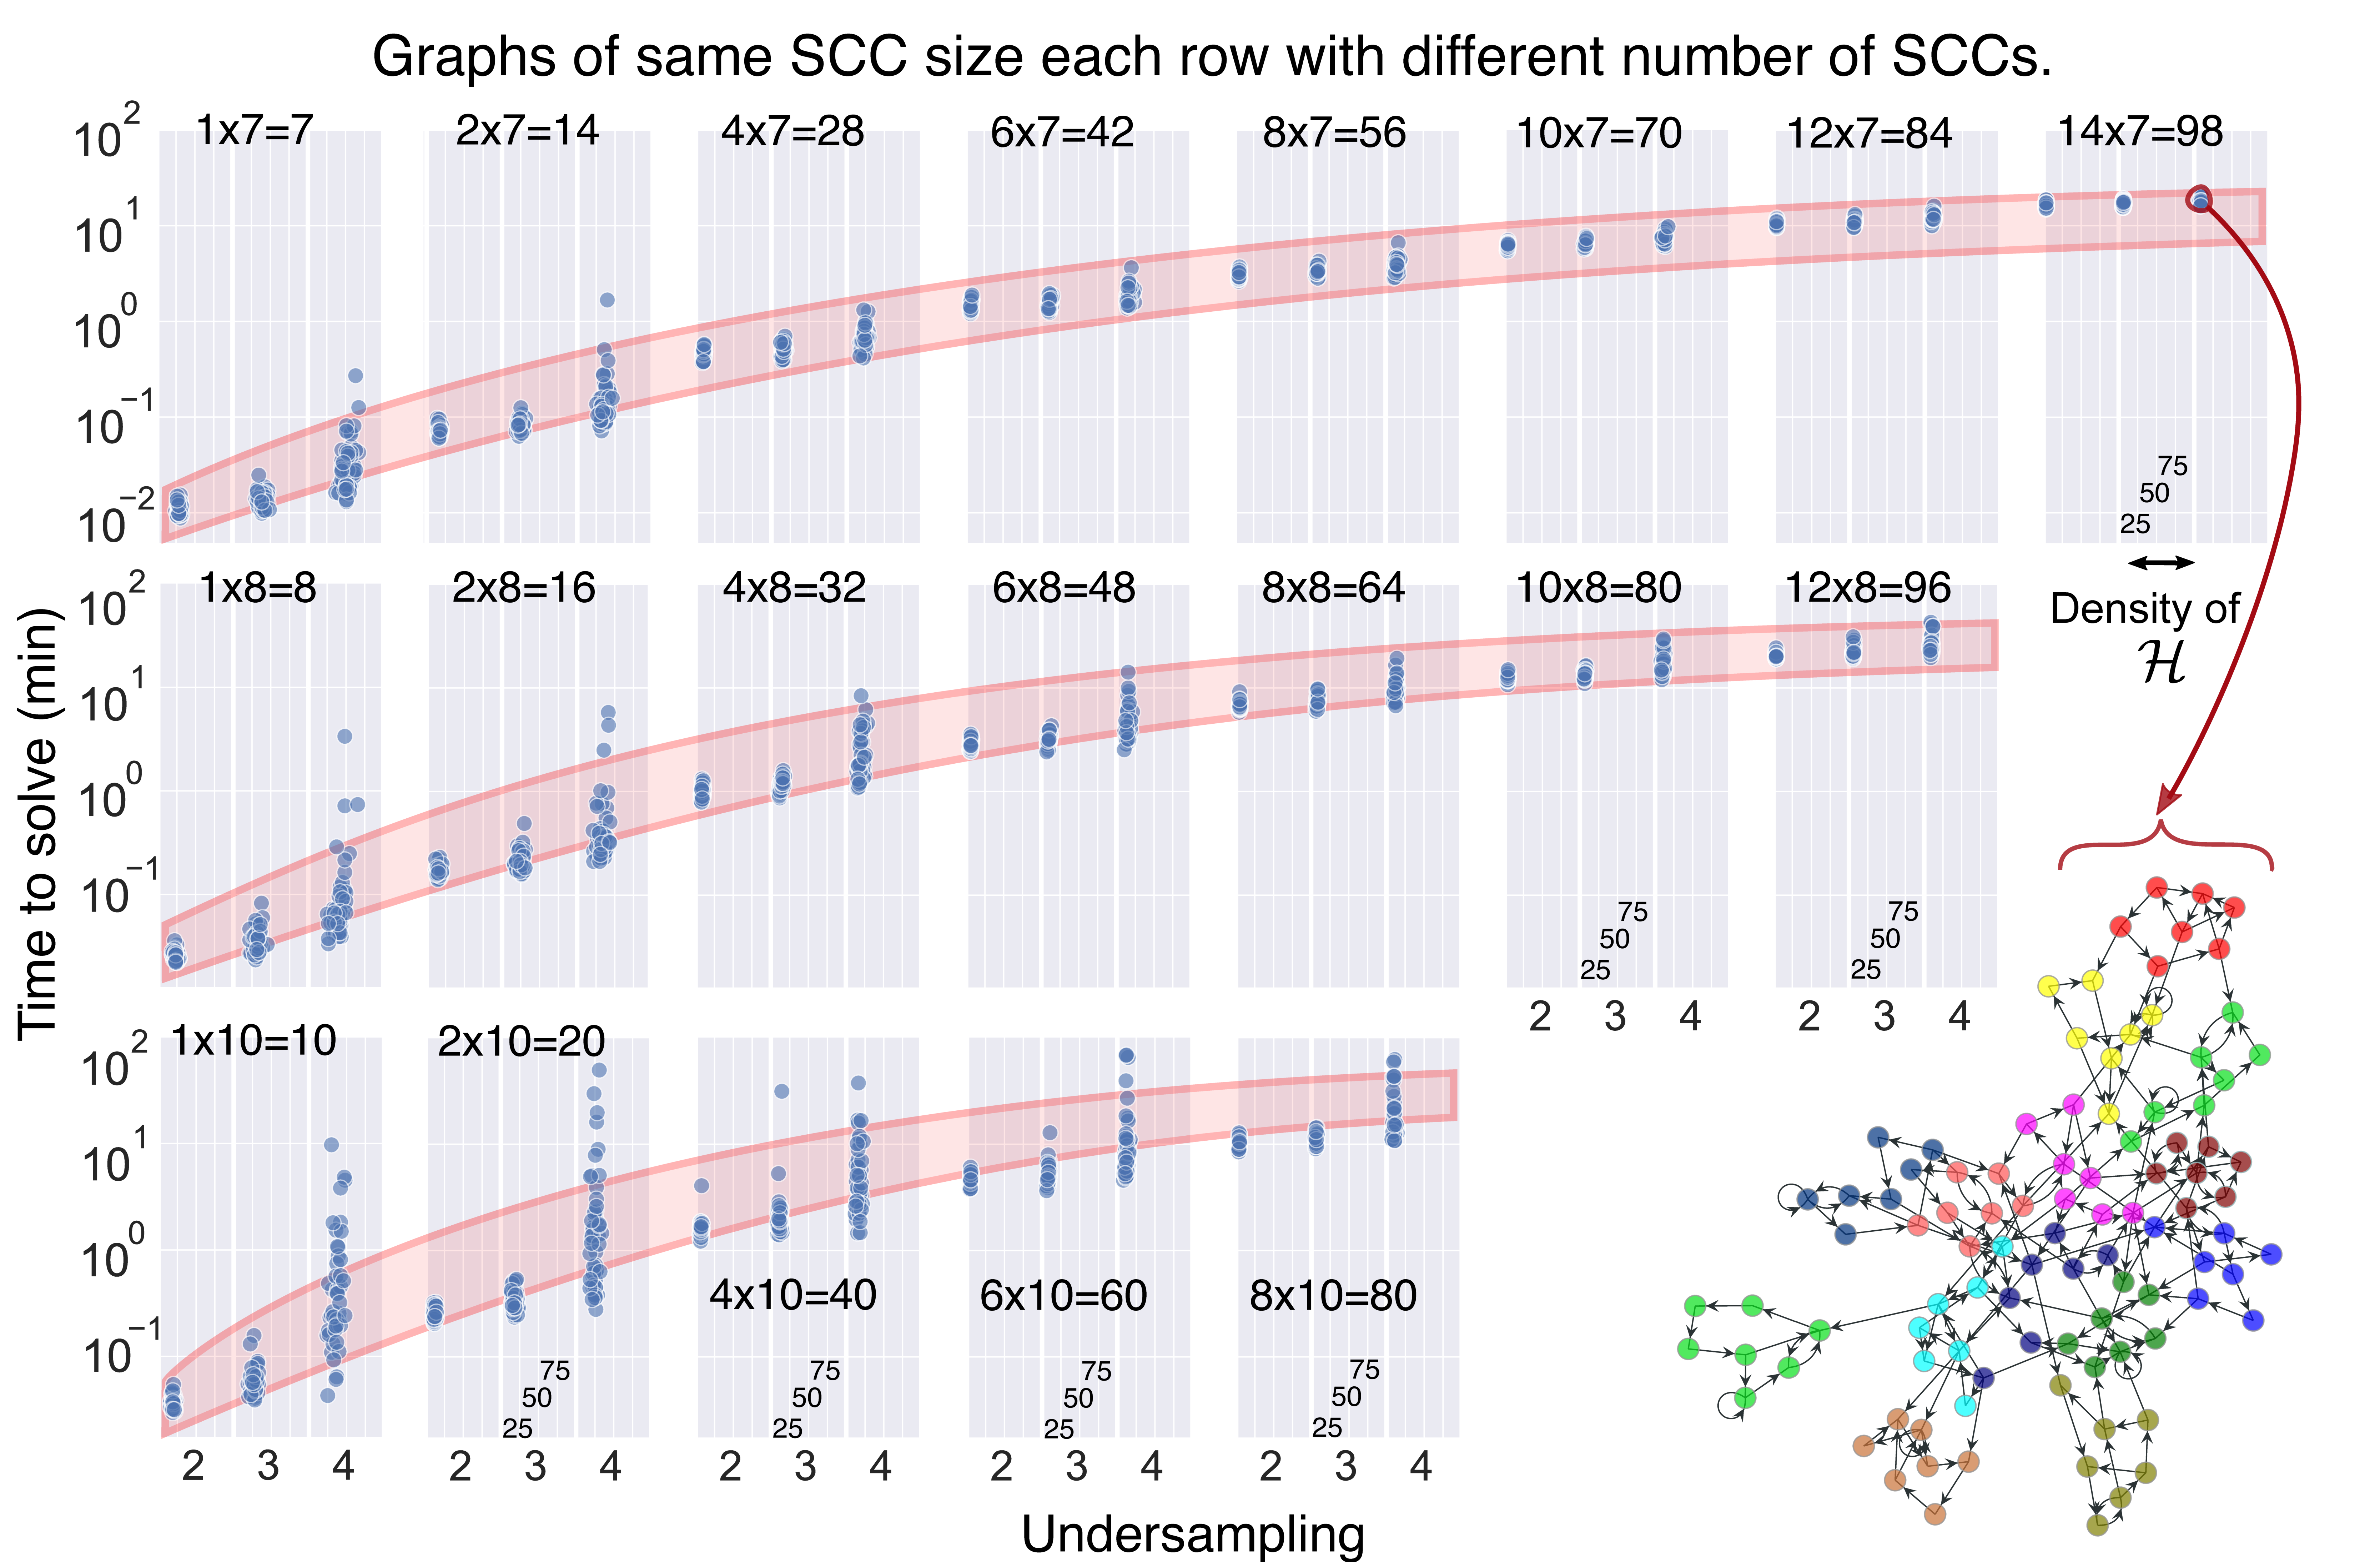
Benchmark analysis of GRACE-C's computational efficiency with realistic graph structures. Alaysing graphs of up to 100 nodes. Previous methods were limited to 6 nodes.
Causal Learning through Deliberate Undersampling
▼This research challenges a fundamental assumption in data-driven science. The common belief is that to improve causal discovery, one must always measure a system faster. Our innovation was to formally prove this is incorrect: we show that new information can be gained by deliberately adding a slower measurement. This counter-intuitive "non-monotonic undersampling" phenomenon works because the slower timescale provides a different "perspective" on the system, helping to eliminate "causal illusions" (ambiguities) that exist at a single timescale.
To operationalize this discovery, this project introduced the dRASL algorithm. This demonstrates advanced skills in Answer Set Programming (ASP), as dRASL is a novel generalization of our previous sRASL solver. Instead of just solving for one observed graph, dRASL is designed to find the joint equivalence class of causal structures consistent with multiple graphs from different timescales (e.g., Hu and Hv).
The mathematical rigor of this work is grounded in the formal conditions for non-monotonicity. We performed extensive computational experiments to validate the theory. The key results are:
- It Works: We proved the phenomenon exists. In one example, adding a slower graph (G5) to an existing one (G4) reduced the equivalence class (the number of possible solutions) from 11 graphs to 3.
- It's Common: This benefit is not a rare edge case. We found it occurs most frequently in sparse causal graphs—a property that aligns with the density of many real-world systems, such as brain or social networks.
- It's Powerful: The "gain" from this method is significant, commonly reducing the solution space by 1-2 orders of magnitude (10x-100x), with some cases showing a 1000-fold reduction.
This research provides a new, low-cost path for improving causal discovery and shows that historical, slower-timescale data can be reused to gain new insights.

This figure illustrates why adding a slower measurement can be beneficial. (a) Monotonic Undersampling: This shows the standard intuition. The set of possible "true" graphs for a fast measurement (G5, orange) is fully contained within the set for a slower measurement (G6, blue). Combining them gives no new information. (b) Non-Monotonic Undersampling: This is the paper's key finding. The set of possible graphs for the fast measurement (H5, orange) and the slow measurement (H6, blue) only partially overlap. By finding the graphs that are consistent with both (the green intersection), we get a smaller, more refined set of solutions than either measurement could provide alone.
This figure answers the crucial question: "When is adding a slower measurement actually useful?" The charts map the properties of thousands of simulated "true" causal graphs, comparing their density (sparse-to-dense, on the x-axis) to their temporal complexity (how many "illusory" graphs they produce, on the y-axis). Left Panel (a): Shows the general distribution of all simulated graphs. Middle Panel (b): Isolates only the special graphs where adding a slower measurement successfully reduced ambiguity. Right Panel (c): This panel directly shows the difference and reveals the key insight. The "gain" (the red area) is not randomly scattered; it is systematically concentrated in sparse, low-density graphs (density ~0.2-0.4). The big-picture takeaway: This benefit is not just a theoretical curiosity. It is most effective for the exact types of sparse networks that scientists frequently study in the real world, such as brain or social networks.

This figure quantifies the practical payoff of deliberately adding a slower measurement. The Y-axis measures the "information gain" on a logarithmic scale. A value of 2 means the number of possible "true" graphs is reduced 100-fold, and a value of 4 means a 10,000-fold reduction. Left Panel (The "True" System): This shows when the method works best. The highest gains (dark red spots) are overwhelmingly found when the true, underlying causal system is sparse (low density, ~0.1-0.25). Right Panel (The "Observed" System): This is the key insight for a scientist. It shows that even when your measured graph looks dense and complex (high density, ~0.7-0.8), it is very likely one of those sparse systems where this method provides a massive, exponential gain in understanding. The big picture: The benefit isn't small. For the right kind of problem—a sparse system that looks complex—adding a single, slower measurement can dramatically shrink the "search space" of possible explanations.
Greedy AutoAugment
▼Greedy AutoAugment: Efficient Data Augmentation Search
This project tackles a major bottleneck in modern deep learning: the extreme computational cost of finding optimal data augmentation policies. While AutoAugment proved that learning policies from data leads to state-of-the-art results, its reliance on a complex Reinforcement Learning (RL) controller to search an exponential search space makes it impractically expensive. This forces most researchers to re-use pre-trained policies on new datasets, which, as this paper shows, can actually hurt performance.
Our Greedy AutoAugment (GAutoAugment) is an innovative solution that replaces this "black-box" RL approach with a highly efficient, transparent, and more effective search algorithm. This work demonstrates deep skills in algorithmic design, computational optimization, and complexity analysis.
Innovation and Mathematical Rigor
The core innovation is a greedy, layer-by-layer search that transforms the problem's complexity.
- Algorithmic Redesign: We replaced the slow RL controller with a Greedy Breadth-First Search. The algorithm iteratively builds policies, starting with a single augmentation (layer 1) and evaluating all combinations. It then greedily selects the best-performing policy from that layer to serve as the base for the next layer of the search.
- Search Space Transformation: The key mathematical insight was to decouple the search variables. Instead of searching for (technique, probability, and magnitude) simultaneously, we fixed the probability to 1 during the search. This single design choice, combined with the greedy search, fundamentally changed the computational complexity from an exponential growth (O(Nl)) to a linear growth (O(N×k)).
- Statistical Re-weighting: After the highly efficient search identifies the best policies, we re-introduce probabilities in a statistically sound manner. We use a Pareto distribution to assign higher selection probabilities to the policies that achieved higher accuracy during the search. This ensures that better policies are used more often during the final model training.
Key Results
This algorithmic and mathematical rigor directly translated into superior performance.
- Massive Efficiency: GAutoAugment finds better policies while using 360 times fewer computational resources than the original AutoAugment.
- Superior Accuracy: By being efficient enough to find dataset-specific policies, GAutoAugment consistently improved accuracy across four datasets (Tiny ImageNet, CIFAR-10, CIFAR-100, and SVHN) and 11 different neural network architectures.
- Solved Transferability: We demonstrated that transferring policies is sub-optimal. The "one-size-fits-all" AutoAugment policy decreased accuracy on Tiny ImageNet by 52% compared to manual augmentation, while our dataset-specific search increased accuracy by 25%.
Greedy search strategy for discovering optimal augmentation policies.
Results and benchmarking againt state-of-the-art methods.
Radiologist-Level COVID-19 Detection Using CT Scans with DECAPS
▼During the COVID-19 pandemic, healthcare systems faced two critical bottlenecks: a shortage of diagnostic tests and a shortage of expert radiologists to interpret CT scans. This project tackled both problems by developing a novel deep learning architecture, DECAPS (Detail-Oriented Capsule Networks), designed to automate COVID-19 diagnosis from CT scans with superhuman accuracy, even when trained on scarce data.
This work demonstrates advanced skills in algorithmic design, generative modeling, and deep learning theory. Our innovations were:
Novel Architecture (DECAPS): We didn't just use a standard CNN. We built our solution on Capsule Networks to better model the part-whole spatial relationships in a CT scan. We fundamentally improved the architecture by introducing:
- Inverted Dynamic Routing (IDR): A new, top-down routing mechanism that forces lower-level capsules to compete for the attention of higher-level ones. This rigorously-designed algorithm proved more stable and was crucial for filtering out noise from non-descriptive regions of the lung.
- "Peekaboo" Training: A novel, self-guided training procedure. The model uses its own activation maps to identify a region of interest (ROI). It then crops the ROI to force the network to learn fine-grained details, and drops (removes) the ROI to force the network to find all relevant disease features, not just the most obvious one.
- Generative Data Augmentation: To solve the critical "data scarcity" problem, we employed conditional Generative Adversarial Networks (cGANs). We used a pix2pix model to learn the distribution of COVID-19 features and generate hundreds of realistic, synthetic CT scan "deep fakes," which were vetted by our collaborating radiologists.
Key Results
Our approach was a resounding success, demonstrating a clear path to augmenting clinical experts.
- State-of-the-Art Performance: The final DECAPS model achieved 96.1% AUC, significantly outperforming standard, powerful architectures like ResNet50, Inception-v3, and DenseNet121.
- Superhuman Accuracy: The model was benchmarked against three experienced, well-trained thoracic radiologists. On a high-quality, curated test set, DECAPS significantly outperformed all three human experts, achieving 98% AUC.
- Interpretable & Collaborative: The model generates Head Activation Maps (HAMs) to visualize exactly what regions it used to make its diagnosis. The clinical utility was so high that in one case, a radiologist revised their initial diagnosis after seeing the features our AI had highlighted.
DECAPS architecture with head activation maps for COVID-19 detection.
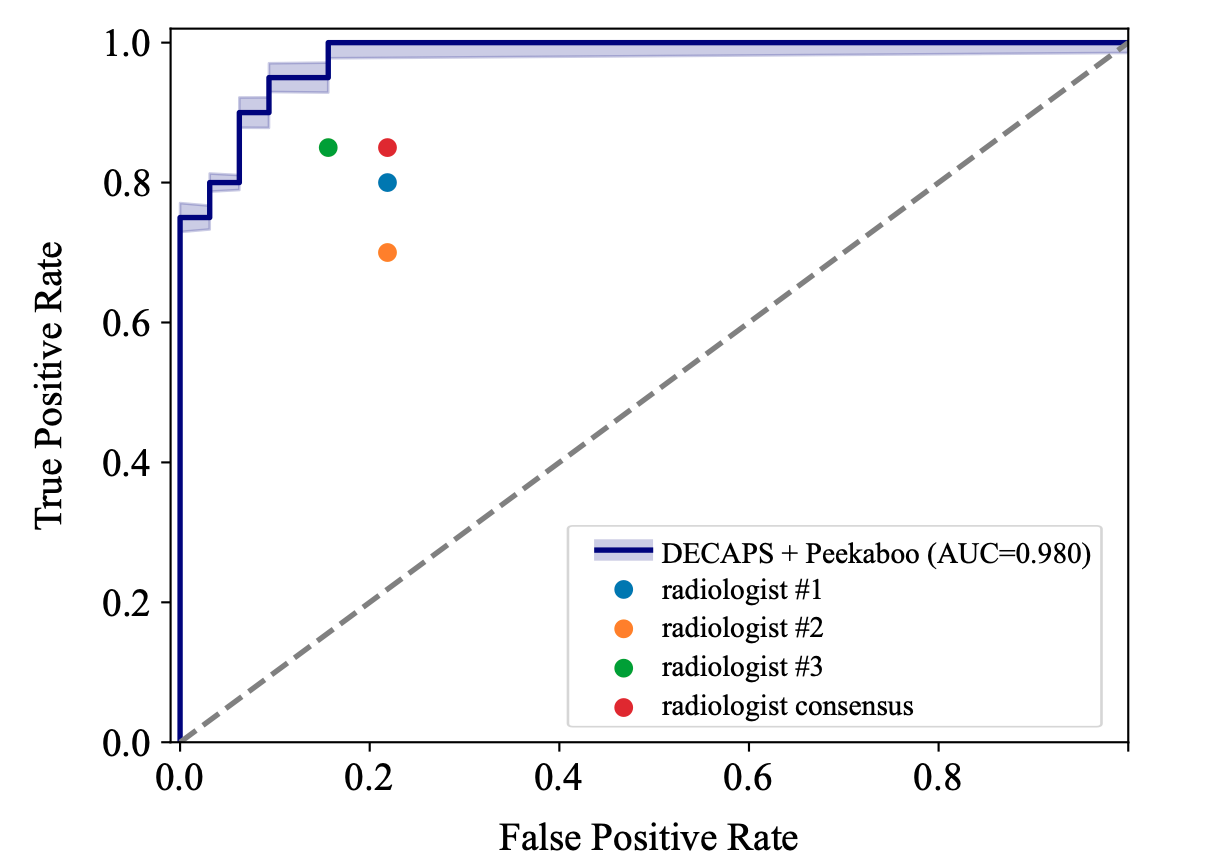
Diagnostic performance metrics showing radiologist-level accuracy.
RnR: A Meta-Solver for Causal Discovery in Undersampled Time Series
▼This line of work confronts one of neuroimaging's toughest challenges — recovering the true causal structure from undersampled, noisy time series data. It began with the preprint "Piecing Together the Causal Puzzle" (Highway to Causality), which showed that ASP-based solvers could rigorously explore and prune the space of candidate causal graphs on real fMRI data. The latest evolution of this work is RnR (Rock 'n' RASL), a meta-solver submitted to NeurIPS 2026.
RnR plugs into the output of any causal discovery algorithm (PCMCI, FASK, MVGC, GIMME, etc.) and refines it by explicitly modeling undersampling effects via ASP, achieving globally optimal solutions while scaling to realistic graph sizes.
Technical highlights:
- Grounding complexity O(n³·u): Polynomial growth in graph size and undersampling rate — no exponential blowup.
- SCC decomposition: Reduces per-component search from 2(n²) to 2(s²), giving linear scaling across components (~4 orders of magnitude reduction in search space for typical graphs).
- Parallel CDNL search: 15 parallel Clingo threads with the Crafty heuristic.
- Three-stage lexicographic optimization within a single solve call: density → latent structure → edge orientation, preserving global optimality guarantees at every stage.
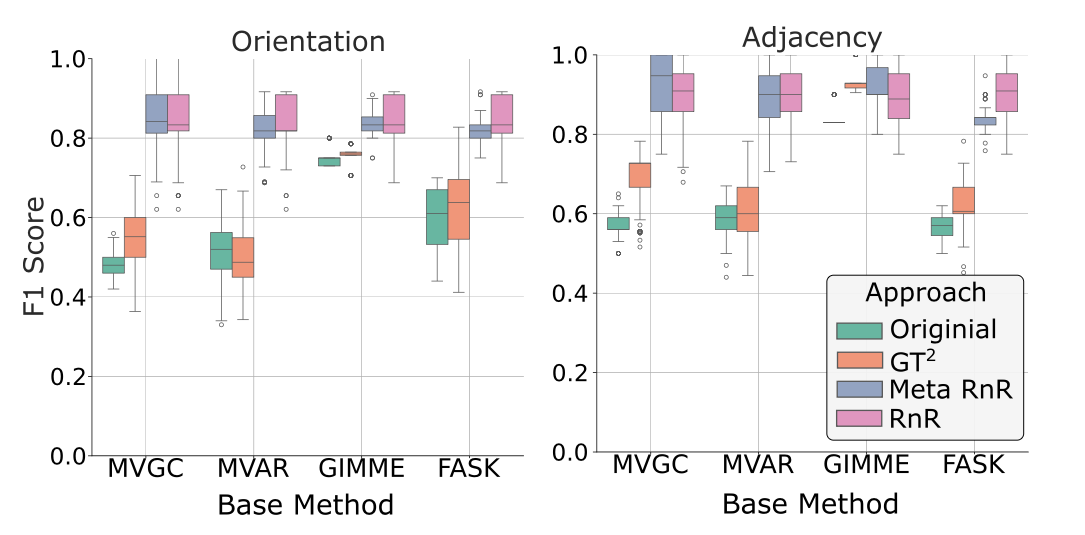
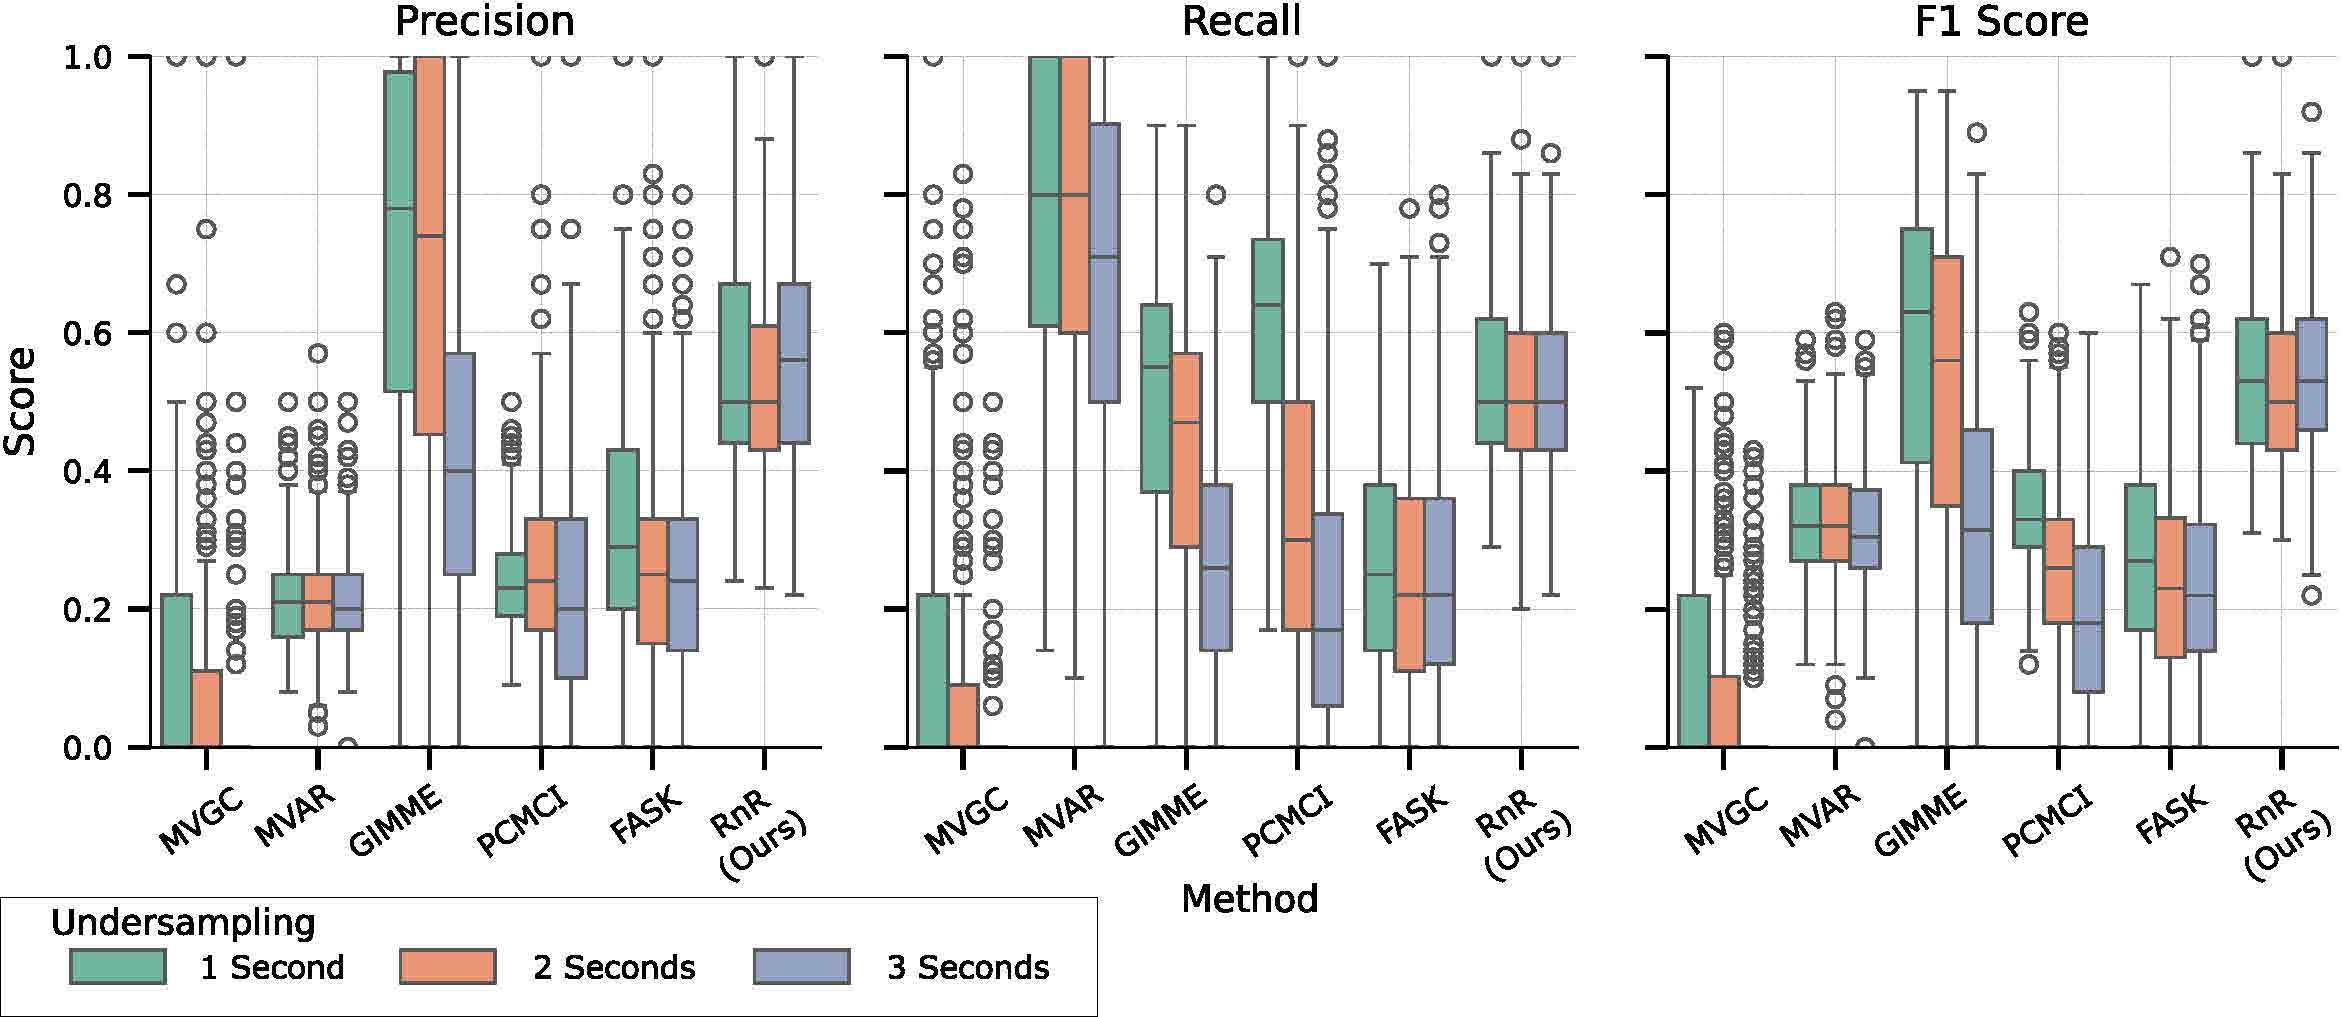
Results: 45% F1 improvement over SOTA baselines. Robust performance on simulated fMRI data, accurately preserving the BOLD signal across varying undersampling rates. Validated on real resting-state fMRI for schizophrenia detection.
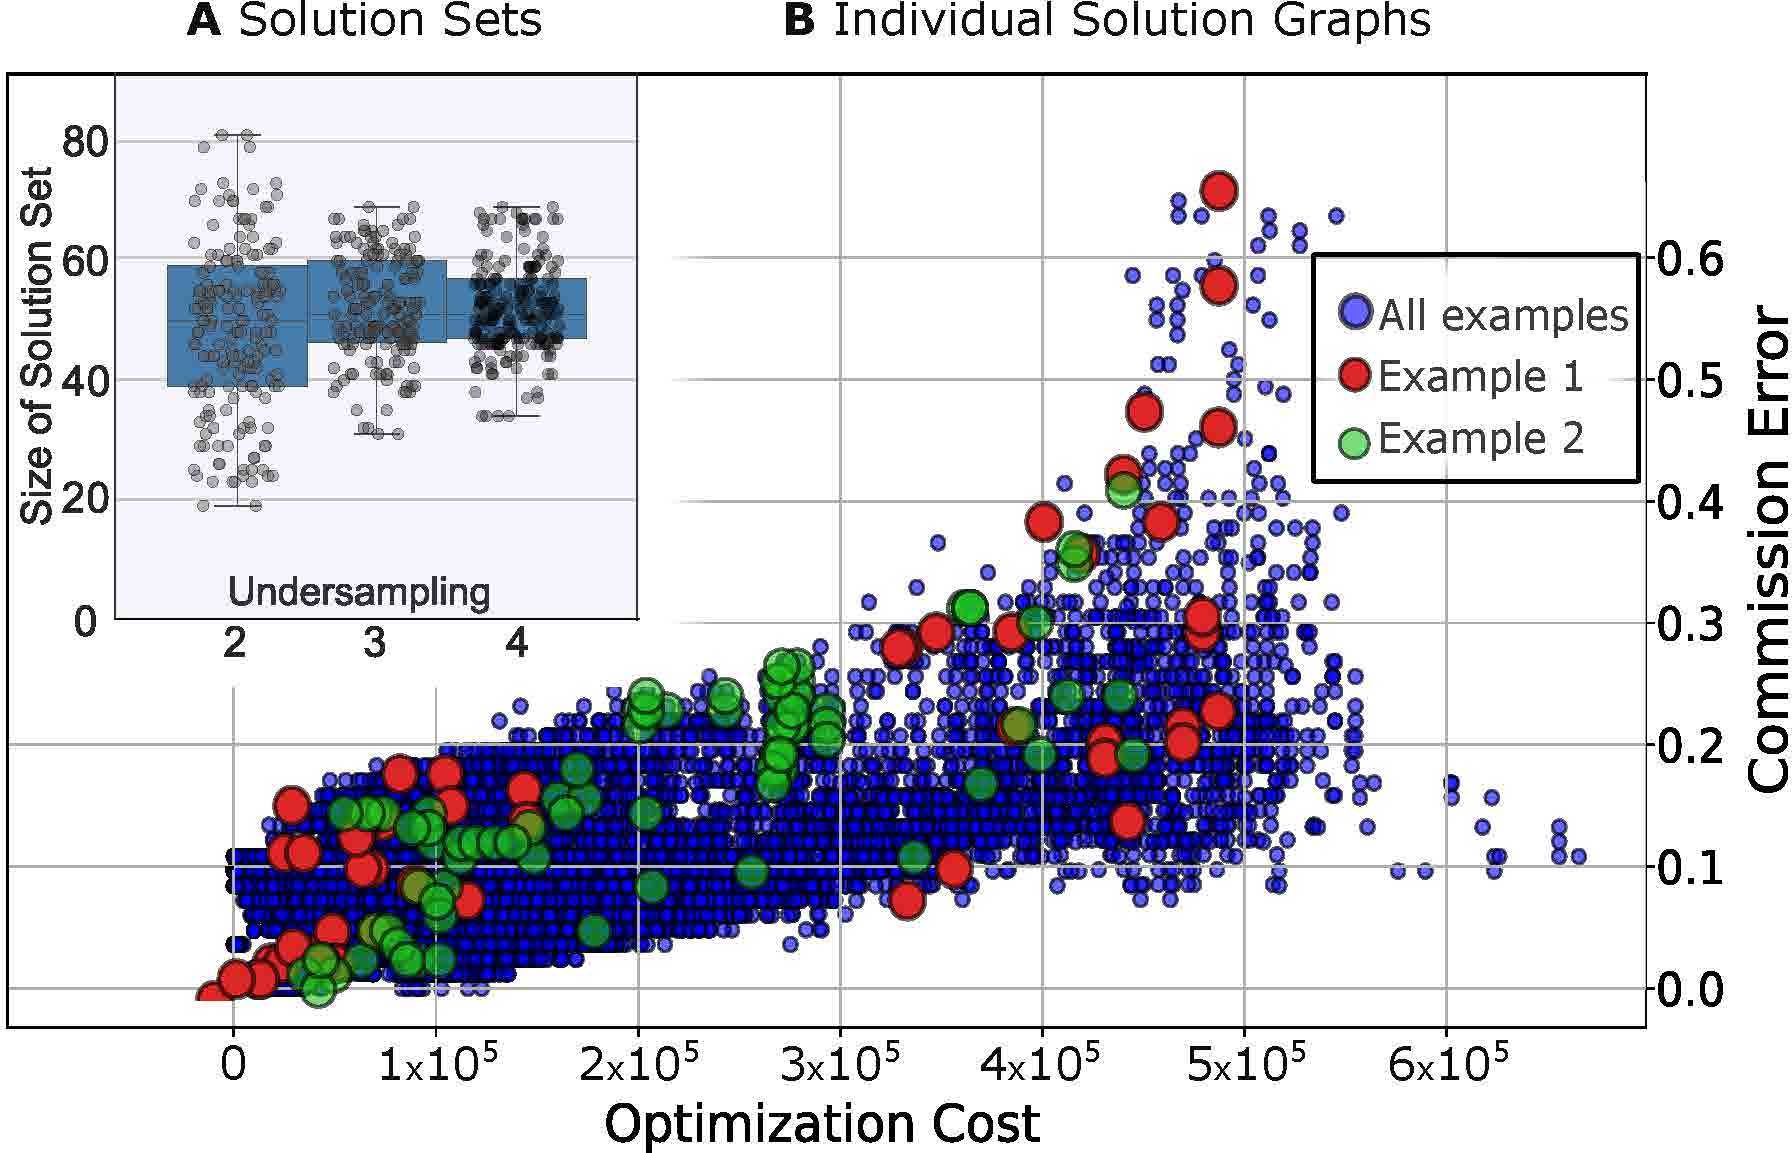
Optimization solution set size and commission error across different undersampling rates.
ASP-based causal graph recovery from undersampled noisy neuroimaging data.
Impact of undersampling rates on BOLD signal preservation in fMRI data.
ION-C: Integration of Overlapping Networks via Constraints
▼This project introduces ION-C, a computationally efficient algorithm that builds a single, unified causal model from separate, partially overlapping datasets. We solved a major scalability problem with the original "ION" algorithm, which was unusable on graphs with more than 6 nodes
Our key achievement was reformulating the problem using Answer Set Programming (ASP), creating a new method that is provably sound and complete. We successfully scaled this new algorithm to graphs with up to 25 nodes.
Simulation results showed extremely high accuracy: causal links that appeared in ≥90% of solutions were 99.55% accurate to the ground truth. We also demonstrated a real-world application on European Social Survey data, where ION-C successfully identified a plausible causal connection between two variables that were never measured together in the same survey.
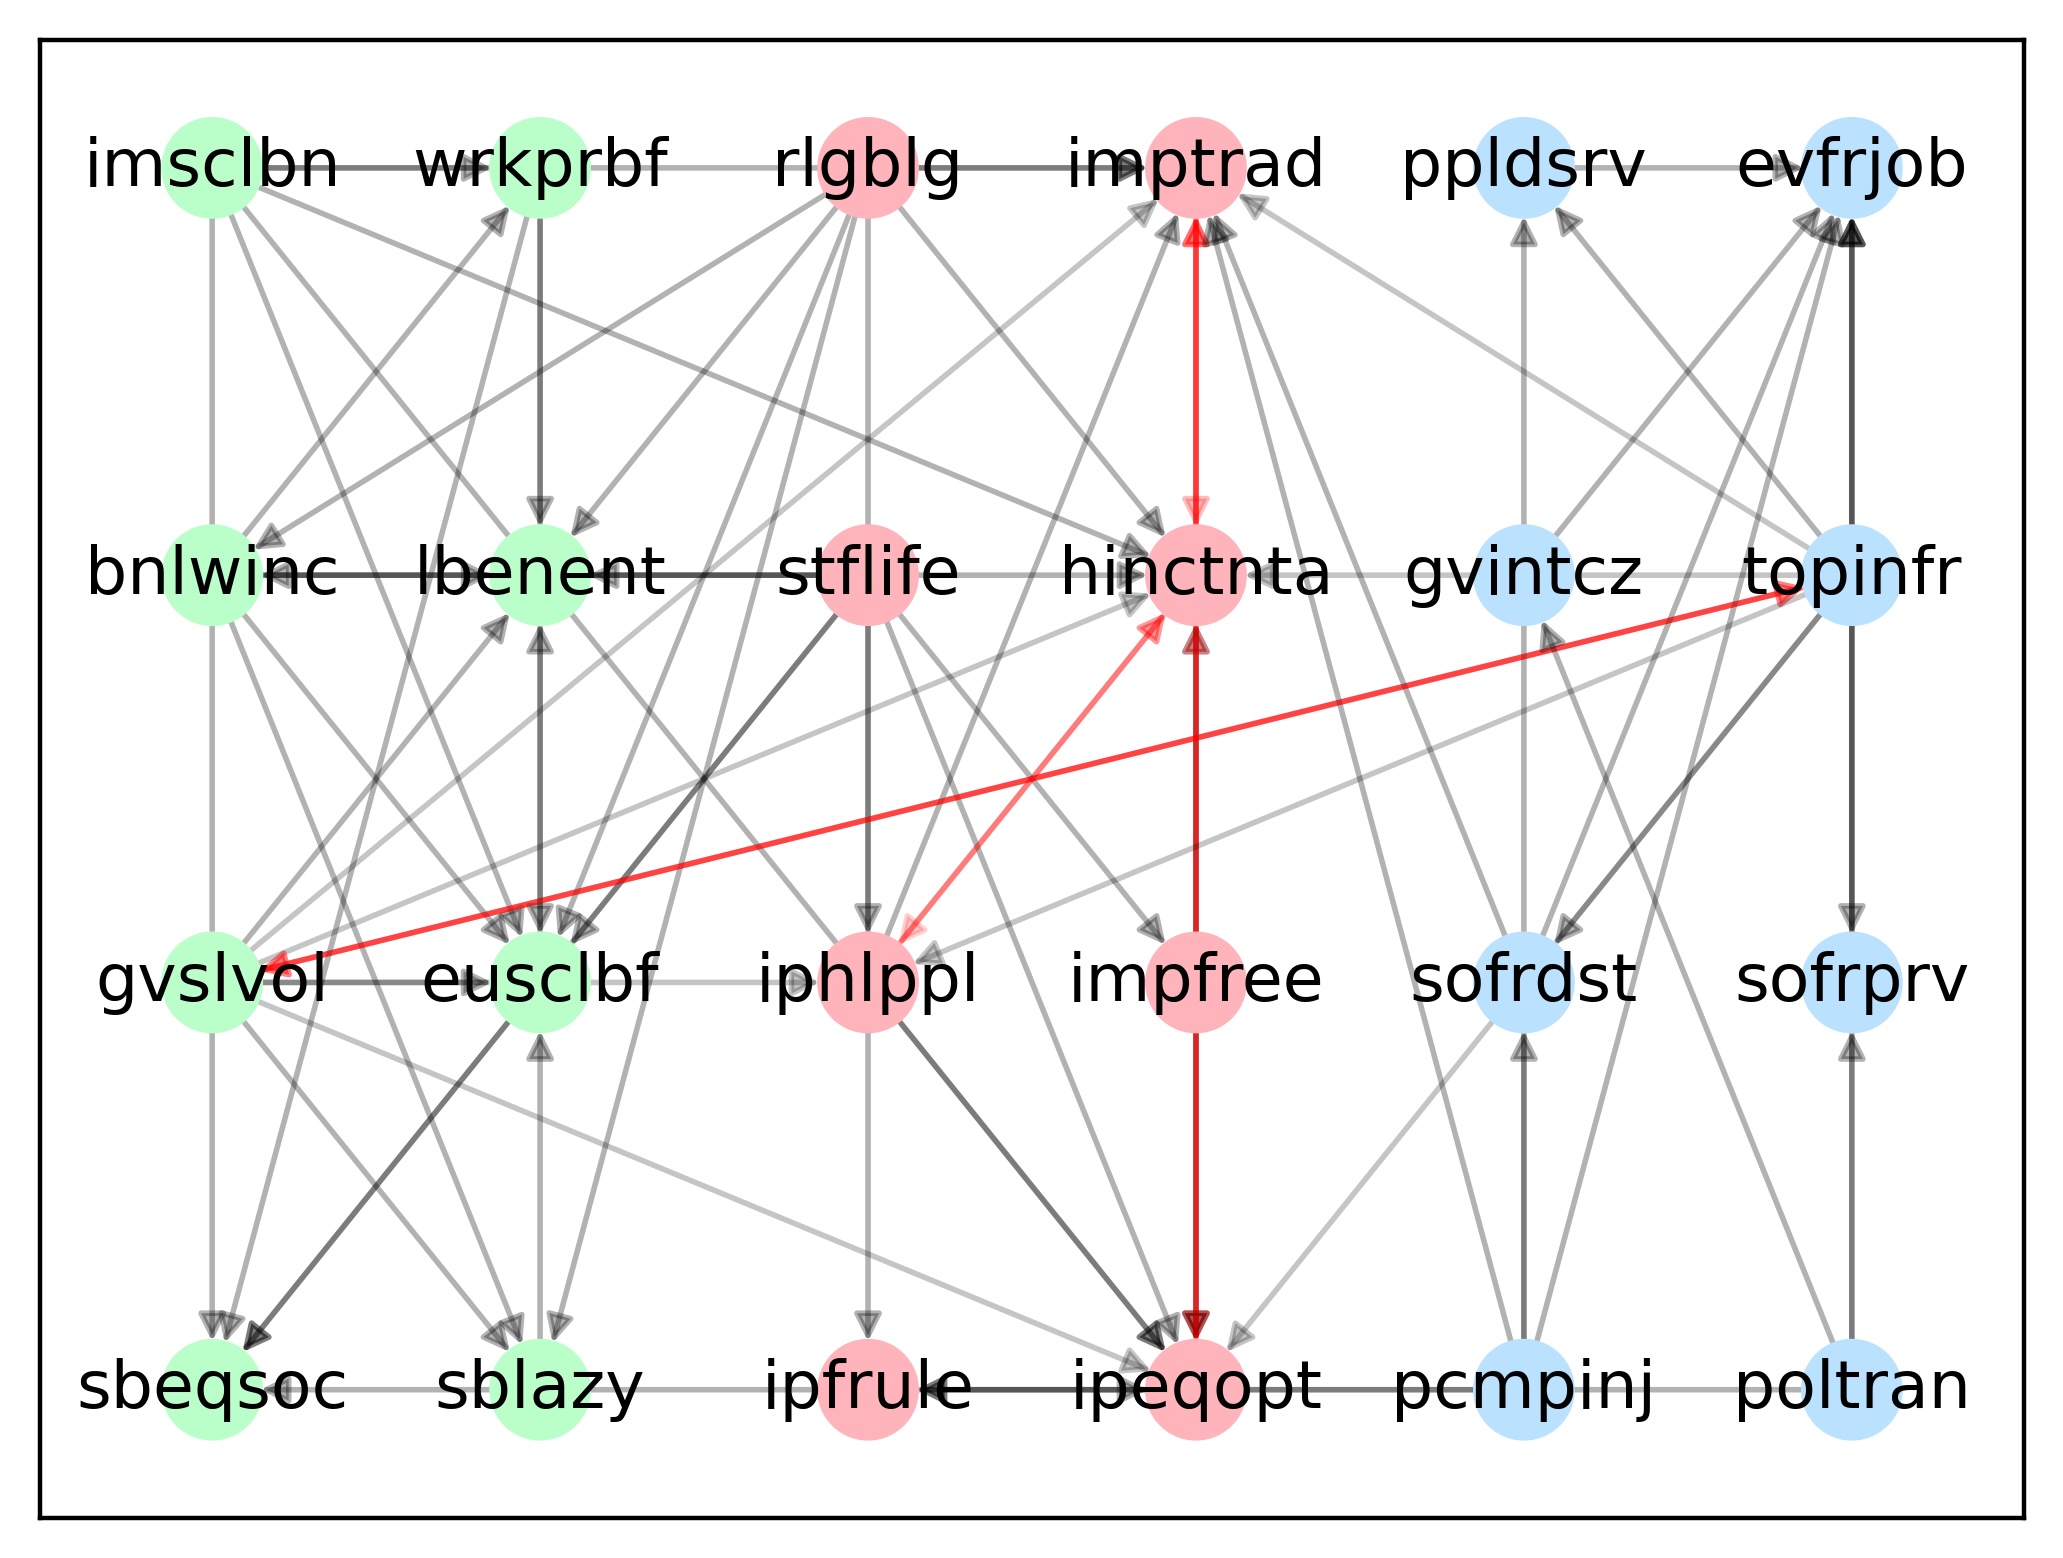
Representation of ION solution set showing network integration.
Technical Projects
LLM-Guided Causal Graph Selection (llm-causal-select)
▼The gunfolds RASL algorithm efficiently enumerates all causal-timescale graphs consistent with an observed undersampled time series. In practice, this equivalence class often contains dozens of candidates — choosing among them traditionally requires domain knowledge or expensive additional constraints. llm-causal-select replaces that manual step with a learned LLM-based selector.
Approach:
- Fine-tuned Mistral-7B-Instruct (also supports Llama-3-8B) with LoRA / QLoRA on synthetic training examples generated by gunfolds' own causal simulator. No public dataset covers this task — every training example is produced from the same ground-truth simulator used in the RnR work, making the fine-tuning genuinely domain-specific.
- 4-bit quantization via bitsandbytes NF4, allowing 7B-scale training on a single 24GB GPU.
- PEFT + instruction tuning with custom prompt masking in the PyTorch Dataset, so loss is computed only on the target completion.
- HuggingFace Transformers + Accelerate training stack, with a clean YAML-config + dataclasses architecture.
- Evaluation metrics: SHD, edge-F1, top-1 selection accuracy against held-out ground-truth graphs.
At inference time the LLM reads the observed undersampled graph and the RASL candidate list, then outputs the most likely ground-truth DAG — acting as a learned prior over the equivalence class and a drop-in complement to gunfolds' drasl().
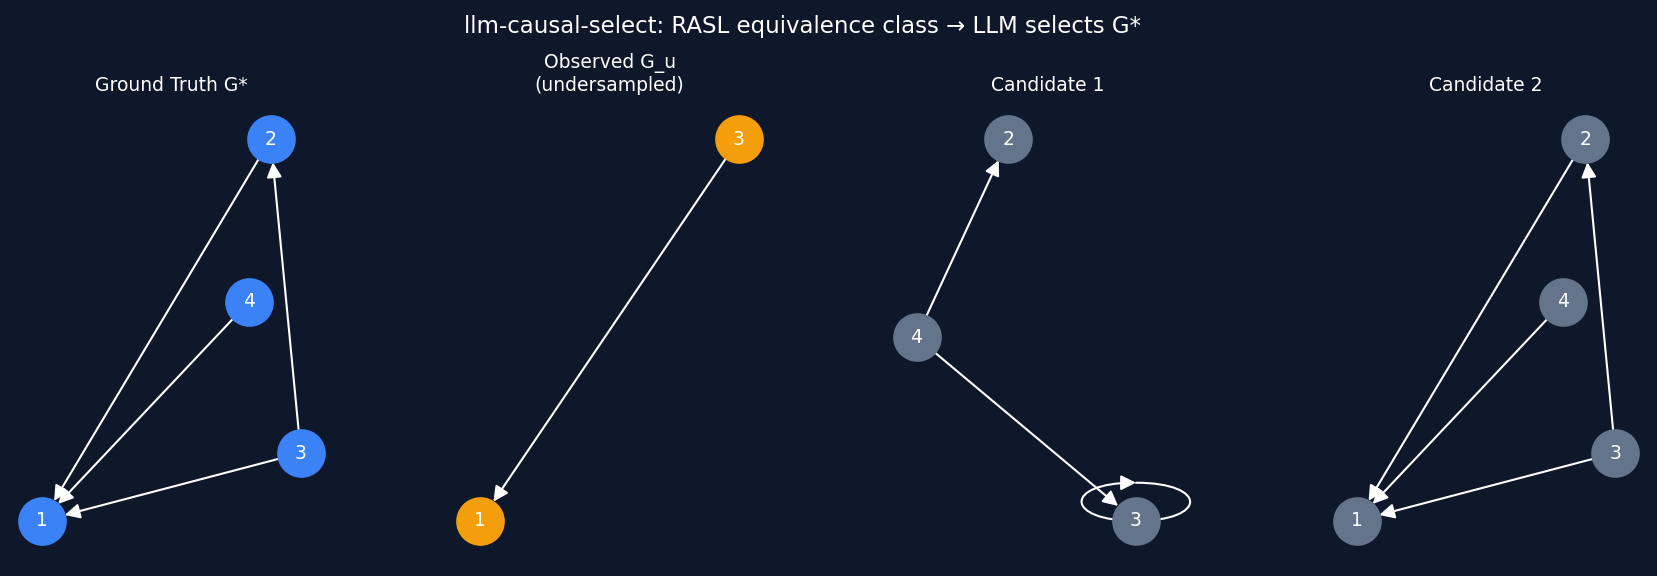
Pipeline: gunfolds simulator generates (G*, G_u, candidates) triples → GraphFormatter converts to prompt/completion JSONL → LoRA fine-tuning → LLMCausalSelector at inference.
Quantfolio: Quantitative Portfolio Intelligence Platform
▼Quantfolio is a portfolio-aware signal engine for the terminal: it watches your holdings and surfaces only the news that changes your decisions — ranked, filtered, and quiet. Not a dashboard. Not a feed. A three-tier attention system designed around how traders actually process information.
Three attention tiers:
- Morning brief — exactly 3 ranked signals with a 1–2 sentence synthesis (Claude API or rule-based fallback). Run once at market open.
- Hourly digest — silent terminal output of deltas during market hours. No push unless threshold crossed.
- Push-now — rare, rate-limited (default 2/day). Earnings miss on held position, trading halt, M&A, FDA ruling, analyst revision above threshold. Delivered via ntfy.sh (phone, no account needed) or macOS desktop notification.
4-axis scoring pipeline:
- Materiality — keyword rubric (earnings, FDA, halt, M&A…) × source tier (Reuters/Bloomberg > Yahoo Finance > Google News).
- Portfolio impact — score multiplied by position weight. A 40% holding on the same event scores 2.2× a 2% holding. Unheld tickers attenuated to 0.4×.
- Novelty — SHA-256 dedup on normalized title + source. Prevents yesterday's story resurfacing regardless of minor edits.
- Urgency — keyword boost for time-sensitive language (tonight, breaking, halted).
Additional features:
- SQLite persistence — positions, seen headlines, and signal log with user ratings stored at
~/.quantfolio/quantfolio.db. - Theme graph — 20 curated sector themes (AI, semis, defense, space…) in YAML. When a theme trends but you hold none of its members, brief surfaces proxy ETFs.
- Journal command — interactively rate signals as useful/noise; structures feedback for future weight tuning.
- Zero-config brokerage import — auto-maps Fidelity, E*TRADE, Schwab, IBKR CSV exports.
- cron/launchd templates — deploy/ directory ships ready-to-use automation for macOS.
Stack: Python 3.10+, yfinance, feedparser, rich, PyYAML, SQLite, Anthropic SDK (optional), ntfy.sh, osascript. Fully installable package (pyproject.toml) with unit tests for the scoring and novelty modules.
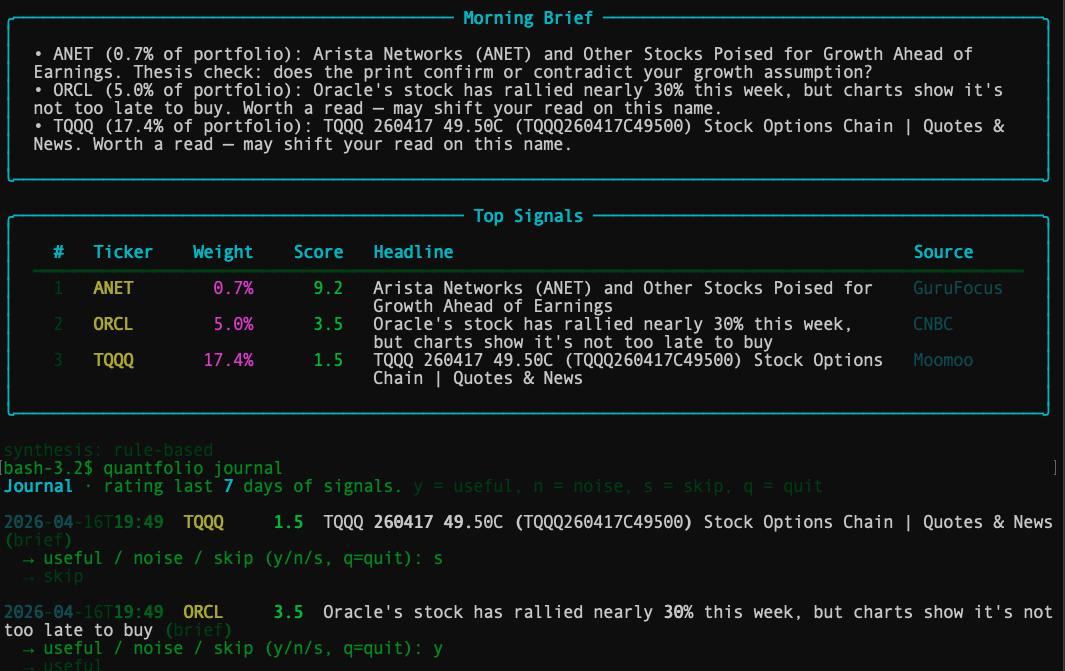
Quantfolio CLI: Rich-formatted portfolio snapshot + ranked news brief with per-ticker panels.
Large Language Models & Knowledge Graphs
▼Worked on integrating Llama 3 with knowledge graphs to improve logical reasoning and problem-solving in AI models. This project explores how structured knowledge can enhance the reasoning capabilities of large language models for complex problem-solving tasks.
Generative Adversarial Networks (GANs) for Self-Driving Cars
▼Trained GANs to augment and improve the classification of street signs under diverse weather conditions using multimodal inputs (image & text). This approach enhances the robustness of autonomous vehicle perception systems.
Topology-Aware Self-Supervised Learning
▼Developed a contrastive learning framework with a topology loss term to reduce texture bias in CNNs, improving generalization in vision tasks. This method encourages networks to learn more robust shape-based representations.
Dynamical System Prediction with Neural Networks
▼Built neural networks (PhICNet) to predict physical systems governed by PDEs, integrating multimodal physics and image data for enhanced spatio-temporal forecasting. This approach combines physics-informed learning with computer vision.
Eye Gaze Tracking Device
▼Designed an eye-tracking device from scratch using C#.NET, OpenCV, Emgu, and AForge libraries. Achieved high-accuracy gaze detection for real-time applications including assistive technology and human-computer interaction.